

Introduction
Cuisine India is a small Indian Takeaway & Restaurant in Belmont, Auckland which is locally owned and operated by an Indian family. Cuisine India is serving their customers with wide range of fresh and delicious food with the real taste of Indian kitchen like different Indian curries (veg/non-veg), plain rice, tandoori roti, and different types of naan. Cuisine India is solely owned by Mr. Jot Singh. Except the delicious curries, they also provide customers with different varieties of authentic dishes in their restaurants like Manchurian (veg/non-veg), potato chicken, biryani, onion bhaji etc. Here; I am going to introduce the financial statement analysis of Cuisine India which was started in 2017 (India, 2017).

The overview of this assignment is to analyse and report on financial statements for a small GST registered New Zealand business which was chosen in Assignment 1 i.e. Cuisine India. Moreover, to be qualified as a small GST registered business in New Zealand the criteria is that the business should have less than 20 employees and the net turnover should be less than 2 million but the turnover should be more than $60,000 NZD to register for GST (IRD, 2019). So, my chosen business Cuisine India qualifies for the above criteria as it has just 8 employees and net turnover is $295,000NZD by which the company was registered for GST.
Cuisine India Financial Statement Analysis and Reporting
The objective of the financial statements is to provide information to all the users of the accounts to help them in their decision making. Financial analysis has different set of tools using the ratios and formulas that assisted with many features of a business like the financial performance of the business (profitability), its financial condition, its strength and weaknesses etc. The Financial analysis is used by different range of people in the business world, such as Internal Users which include the managers, owners, employees, shareholders of the business and External users includes Money lenders, suppliers, government agencies like IRD etc.The process of financial analysis is that it requires to analyse, interpret and evaluate the results of the analysis undertaken by using the correct method and formulas that are relevant to the users and their needs. There are different methods of analysing the financial statements such as Vertical analysis, Horizontal analysis, Trend analysis and Ratio analysis (McIntosh, 2011). It was required by the assessment to analysis the financial statements by using ratio analysis so the analysis is given below the financial statements.
INCOME STATEMENT
CUISINE INDIA (BELMONT) | |||
INCOME STATEMENT | |||
For the Year Ended 31st March 2018-2019 | |||
PARTICULARS | Notes | Amount($) | |
2018 | 2019 | ||
Sales | 295,000 | 308,000 | |
Less:- Cost Of Goods Sold | (114,500) | (124,000) | |
Gross Profit | 180,500 | 184,000 | |
Other Revenue | 38,500 | 45,000 | |
Less:-Operating Expenses | |||
Selling Expenses | |||
Advertisement | (7,000) | (6,000) | |
Repair & Maintenance | (6,000) | (8,000) | |
Administrative Expenses | |||
Rent | (62,000) | (64,000) | |
Insurance | (6,000) | (6,000) | |
Electricity Bill | (7,500) | (10,000) | |
Wages & Salaries | (94,000) | (120,000) | |
Water Bills | (5,500) | (6,000) | |
Training Cost | (3,495) | (4,875) | |
Depreciation Expenses | (6,885) | (6,885) | |
Rubbish Removal | (1,800) | (1,800) | |
Financial Expenses | |||
Interest On Loan | (4,500) | (4500) | |
Total Operating Expenses | 214,680 | 238,060 | |
Net Profit | 4,320 | 9,060 | |
BALANCE SHEET
Cuisine India (Belmont) | |||
BALANCE SHEET | |||
As At 31st March 2018-2019 | |||
Assets | Notes | Amount ($) | |
2018 | 2019 | ||
Current Assets | |||
Cash at bank | 12,000 | 15,000 | |
Inventories | 22,000 | 26,000 | |
Account receivable | 4,500 | 6,000 | |
Total current assets | 38,500 | 47,000 | |
Non- Current Assets | |||
Equipment’s | 42,500 | 38,165 | |
Less:- Depreciation | (4,335) | (4,335) | |
Furniture | 25,000 | 22,450 | |
Less:- Depreciation | (2,550) | (2550) | |
Intangibles | 4,275 | 5,595 | |
Total Non-current Assets | 64,890 | 59,325 | |
Total Assets | 103,390 | 106,325 | |
Liabilities & Equity | Notes | Amount ($) | |
2018 | 2019 | ||
Current Liabilities | |||
Account payable | 12,000 | 10,000 | |
Short term loans | 7,000 | 7,000 | |
GST Collected | 38,478 | 40,173 | |
Total Current Liabilities | 57,478 | 57,173 | |
Non-Current Liabilities | |||
Long term loans | 20,000 | 20,000 | |
Total Liability | 77,478 | 77,173 | |
Equity | |||
Owner’s Equity | 14,000 | 15,000 | |
Net profit | 4,320 | 9,060 | |
Retained Earnings | 7,592 | 5,091 | |
Total Equity | 21,592 | 29,151 | |
Total Equity and Liability | 103,390 | 106,325 | |
Statement of changes in equity
Cuisine India (Belmont) | ||
Statement Of Changes In Equity | ||
For the Year ended 31st March 2018-2019 | ||
Particulars | Amount ($) | |
2018 | 2019 | |
Owner’s Equity – Opening Balance | 14,000 | 15,000 |
Retained Earnings | 7,592 | 9,060 |
Net profit | 4,320 | 5,091 |
Total Equity – Closing Balance | 21,592 | 29,151 |
Notes:-
- The given year 2019 in the tables is based on assumptions as the business started in 2017 and the accounting year of the company ends on the 31st March so some of the assumptions have been used by seeing the current figures of the business to end the accounting year for the assignment.
Ratio Analysis
Ratio analysis is used to compare the two or more year’s financial statements against each other by using different formulas, which will help to analyse the performance of each year i.e. 2017-18, 2018-19. There are four different types of ratio analysis:-
- Profitability Ratio Analysis: – This analysis helps to know how profitable the business has been in two years and helps the business to know where they need to improve (McIntosh, 2011). There are two types of Profitability ratio analysis:
- Gross Profit Margin: It is a financial measure which is used to determine the financial health of the company. It reveals how much money is left over, after paying for different expenses like Raw material, labour, production of goods (Gross profit Margin). The Result is: higher the percentage, the better will be the results.
Formula:
Gross Profit Margin= Gross ProfitSales*100
2018 | 2019 | ||
Calculation | Percentage (%) | Calculation | Percentage (%) |
=180,500295,000*100 | 61.2% | =184,000308,000*100 | 59.7% |
It can be analysed from the above table that in the year 2018 the Gross Profit margin was 61.2% which got decreased in the year 2019 by 1.5 % i.e. 59.7%. In the year 2018 the company was having better results due to higher percentage.
- Gross Profit Mark-Up: – It is the difference between the selling price of a good or service and its cost. In other words, it shows the average mark-up between the cost of the goods sold and the achieved selling price (Smart, M.J., Awan, N., & Baxter, R., 2012). The result is : the higher the percentage better will be the results
-
Formula:
Gross Profit Mark-Up=Gross ProfitCost of Goods Sold*100
2018 | 2019 | ||
Calculation | Percentage (%) | Calculation | Percentage (%) |
=180,500114,500*100 | 157.6% | =184,000124,000*100 | 148.4% |
In the year 2019, the gross profit mark-up calculated is 148.4% which less as compared to the previous year 2018 i.e. 157.6% and it is showing better result due to higher percentage.
- Asset Utilization Ratios Analysis: – These ratios help to explain how much assets are used by the business to make the sales i.e. how efficiently the assets used by the business has been managed (Smart, M.J., Awan, N., & Baxter, R., 2012).
a) Sales/Total assets: – This ratio helps to explain the how well the Business use their total assets and generate the profit from the sales (Smart, M.J., Awan, N., & Baxter, R., 2012).
Formula:
=Total SalesAverage Total Assets
Average total assets
=opening+closing 2
=103,390+106,325 2= 156552.5
2018 | 2019 | ||
Calculation | Solution | Calculation | Solution |
=295,000103,390 | 2.8 | =308,000156,552.5 | 2.0 |
By analysing the table it was found that in the year 2019, the company showed a minor fluctuation as compared to the previous year 2018 i.e. 2.8 in 2018 to 2.0 in 2019.the result for the calculation is that the higher the ratio better will be the result.
b) Sales/ Non-Current Assets: –
This helps to measure the efficiency of the business’s equipment, plant, property and other non-current assets (Smart, M.J., Awan, N., & Baxter, R., 2012).
Formula:
=Total SalesNon-Current Assets
2018 | 2019 | ||
Calculation | Solution | Calculation | Solution |
=295,00064,890 | 4.5 | =308,00059,325 | 5.2 |
In the year 2018, the sales of goods and services provided by the company got increased by 4.5% and reached 5.2% in the year 2019 .So the year 2019 is showing better result as it has higher ratio.
c)Day’s Sales Inventory: – This formula helps to measure the Inventory i.e. how many times the inventory has been purchased and sold during the particular financial year (Smart, M.J., Awan, N., & Baxter, R., 2012).
Formula:
=Average of inventoryCost of Goods Sold*365
Average Inventory
=opening+closing 2
=22,000+26,000 2
= 24,000
2018 | 2019 | ||
Calculation | Days | Calculation | Days |
=22,000114,500*365 | 70.1 | =24,000124,000*365 | 70.6 |
It has been analysed from the current table of Day’s sales Inventory that in both the years 2018-19 sales of inventory are mostly the same i.e. approx. 70 days. So, the result of the calculation is almost equal.
- Liquidity Ratio Analysis:-
a) Current Assets/Working capital Ratio: – The working capital ratio represents that to which level the current assets exceed the current liabilities. It also helps to explain how well the business will be able to meet its short term financial debts (Smart, M.J., Awan, N., & Baxter, R., 2012).
Formula:
=Current AssetsCurrent Liabilities
2018 | 2019 | ||
Calculation | Solution | Calculation | Solution |
=38,50057,478 | 0.7 | =47,00057,173 | 0.8 |
The above table for working capital ratio has been analysed and seems to have a minor difference of 0.1 i.e. in the year 2018 it was 0.7 and in the year 2019, it is 0.8.
b) Liquidity Assets- Acid Test/ Quick Ratio: – Liquidity assets are the current assets which can be easily converted into cash within 30 days (Smart, M.J., Awan, N., & Baxter, R., 2012).
Formula:
=Current Assets less InventoryCurrent Liabilities
2018 | 2019 | ||
Calculation | Solution | Calculation | Solution |
=38,500-22,00057,478 | 0.3 | =47,000-26,00057,173 | 0.4 |
While finding the quick ratio it was analysed that both years have the same ratio with the difference of 0.1 which is minor fluctuation in the business year.
- Gearing/ Leverage (Debt) Ratios: – This debt ratio in business discusses how much funds have been borrowed by the business from the outside sources like money lenders, banks etc. Though there is always a risk for repaying the debts on time (Smart, M.J., Awan, N., & Baxter, R., 2012).
a) Total Debt to Total Assets: – This ratio calculates that to what extent assets have been funded by liabilities rather than the sum of money provided by the owners of the company (Smart, M.J., Awan, N., & Baxter, R., 2012).
Formula:
=Total Debt LiabilitiesTotal Assets*100
2018 | 2019 | ||
Calculation | Percentage (%) | Calculation | Percentage (%) |
=77,478103,390*100 | 74.9% | =77,173106,325*100 | 72.5% |
It has been analysed from the calculations in the above table that in the year 2019 the company has a lower percentage as compared to the previous financial year 2018 which reflects that the company has lower debt, lower risk and has great financial stability.
b) Long-term Debt to Equity Ratio: – This is referred to as capital structure of the business in which the money or funds provided by the outside lenders are compared with the funds provided by the shareholders of the company (Smart, M.J., Awan, N., & Baxter, R., 2012).
Formula:
=Non-Current LiabilitiesTotal Equity
2018 | 2019 | ||
Calculation | Solution | Calculation | Solution |
=20,00021,592 | 0.9 | =20,00029,151 | 0.7 |
In the year 2019, the long term debt has a minor fluctuation as compared to the year 2018 i.e. by 0.2.
c)Total Debt to Equity Ratio: – It can also be referred to as capital structure of the business as in this it compares the funding of the shareholders with the funding of the outside sources (Smart, M.J., Awan, N., & Baxter, R., 2012).
Formula:
=Total Debt LiabilitiesTotal Equity
2018 | 2019 | ||
Calculation | Solution | Calculation | Solution |
=77,47821,592 | 3.6 | =77,17329,151 | 2.6 |
The above table has been analysed and found that in the year 2019, the total debt is calculated less as compared to the year 2018 which is lowering the risk of business not being to repay the debt.
Recommendations
The business risk in New Zealand has a wide class. Business risks can be internal such as the strategy or external such as the global economy. The person managing the business should not treat all types of risks in the same way. Firstly, He should understand this thing that what type of risk the company is facing before considering that how they can deal with that situation (Types of Risks Business Facing, 2019). There are four main different categories of Business risks like Strategic Risk, Compliance and Regulatory Risk, Financial Risk and Operational Risk. In this assessment financial risk of the business Cuisine India has been exposed.
Financial Risk refers to a type of Specific risk that includes many types of risks related to a company’s financing, capital structure, and the finance industry. These include risks involving financial transactions, such as Business loans and the exposure to the default. The key difference between Business risk and the financial risk is that financial risk refers to a company’s ability to manage its debt and financial leverage, while business risk refers to the company’s ability to generate sufficient revenue to cover its operational expenses. (Difference between Financial Risk and Business risk , 2016). Financial Risk has four different categories which include:-
- Market Risk
- Credit Risk
- Liquidity Risk
- Operational Risk
- Market Risk: – It is the risk that is incurring due to loss of various things like hikes in interest rates fluctuation in foreign currency values, increase in raw material costs etc. for example: if the exchange rate changes it will directly affect your debt payment. (Risk Management , 2018).
- Liquidity Risk: – This risk affects the ability to meet the short term financial demands to execute the business transactions (Risk Management , 2018).
It is found out that the chosen business i.e. Cuisine India is mostly affected by the Operational and Credit Risk. These risks have been exposed below:-
- Operational Risk: – Operational risk focuses on how you achieve things in your businesses. It is naturally connected with how your business functions internally and this broadly covers the following categories under operational risk like Fraud – taking bribe, doing misuse of assets and tax evasion which will lead to underpayment of tax, Cash theft, data entry errors, discrimination, and staff health and safety. These are the risks that can arise from ordinary business activity. At the point of sales, employees can steal money in many ways such as money taken from the register, refunding the money from the system by voiding ordered items, dropping sales, using 100% discount to the items they purchase and inflating tips. (Risk Management , 2018)
- Credit Risk: – As Cuisine India is buying inventory from their supplier on credit, it can be considered as a risk if they are unable to pay the left amount in given time. So, they should have enough money to pay their debts or else suppliers of the inventories may stop extending credit or they may even stop doing business with Cuisine India (Risk Management , 2018).
Some of the internal controls are recommended to mitigate the identified business risks:-
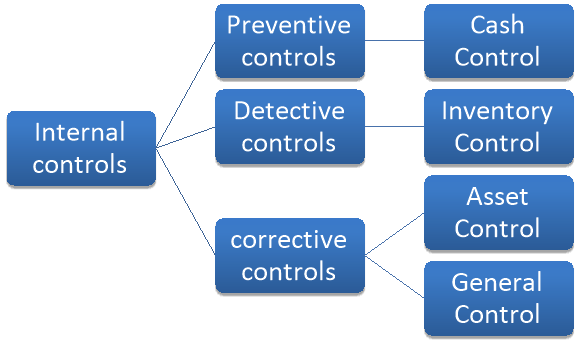
- Preventive controls: – Preventive Control deeds are the most effective of the three types of internal control activities because they are not expensive to implement and they help to prevent the loss of assets first (Internal Controls, 2014). The example of the preventive controls is:-
Cash Control: – All the transactions and business activities that involve cash must be documented properly such as banking, receiving payments and making payments to the customers or the suppliers. All the valuable documents of the business should be recorded manually in a notebook or often stored in a computer and should be updated on their online portal. All the statements should be checked properly while making payments by the manager as well as the owner itself. Moreover, the owner should allow only those employees to use the till who he trusts the most and the owner should also apply a CCTV camera just above the till which can keep an eye on the transactions made.
- Detective Controls: – This is designed to locate problems once they have already occurred in the business. Once the problem is detected the management of the business can easily take steps to reduce the risk that they can occur again in the future (Bragg, 2017). Example of detective control is:-
Inventory Control:- Same as the Cash control, The CCTV camera should be installed near the storage room, proper lock system with an alarm should be also installed in the store to minimize the risk of theft and fraud of inventories, by which the stock will be safe and there will be less wastage of the raw material, and also proper policies should be implemented to keep an eye on inventory, an authorised person like manager, chief or owner himself should take the delivery from the suppliers and should take proper invoice of delivery from the suppliers.
- Corrective Control: – In this type, the activities come in mechanism to see what should be done to fix the errors and irregularity identified by detective Control (Internal Controls, 2014). For Example:-
- Asset Control: – To reduce the risk of asset theft or breakage the owner should install the CCTV cameras in the store. Moreover, the owner should investigate properly while purchasing any of the assets like the type of asset, its use and cost of the asset; he should also sell the assets from the store that are not in use. The business owner should take the full insurance which can cover all the assets like building, fryers, stoves, furniture, freezers etc. as they are the part of the business which helps in making income to the business. So, all the assets should be insured to get rid of paying a huge amount again if any of the assets got damaged.
- General control: – In every 2 weeks a surprise check should be made by the owner to verify the collection and reconciliation of data, to check the stock inventory book and the accounting records. A proper time clock should be made for the staff rather than the making a manual paper roster which would help the owner to know the accurate hours of the employees like the business can register for the TANDA app which helps to make the roster and saves the hours the employee has worked and also help in payroll integration for the employees and the business (Tanda, 2019).
References
- Internal Controls. (2014). Retrieved from Canvas Network: https://learn.canvas.net/courses/37/pages/study-how-do-the-three-types-of-internal-control-activities-safeguard-assets
- Difference between Financial Risk and Business risk . (2016). Retrieved from Academia: http://www.academia.edu/30238725/What_are_the_key_differences_between_financial_risk_and_business_risk_to_a_company_Investopedia
- Risk Management . (2018). Retrieved from NIBUSINESSINFO: https://www.nibusinessinfo.co.uk/content/financial-risk
- Tanda. (2019). Retrieved from Tanda: https://www.tanda.co/
- Types of Risks Business Facing. (2019). Retrieved 2019, from NIBUSINESS.CO.UK: https://www.nibusinessinfo.co.uk/content/types-risk-your-business-faces
- Bragg, S. (2017, September 20). Detective Control. Retrieved 2019, from Accounting Tools: https://www.accountingtools.com/articles/2017/9/20/detective-control
- Gross profit Margin. (n.d.). Retrieved from The Balance small business: https://www.thebalancesmb.com/what-is-the-gross-profit-margin-393201
- India, C. (2017). Cuisine India. Retrieved 2019, from Cuisine India: http://www.cuisineindiabelmont.co.nz/
- IRD. (2019). GST- Registering. Retrieved 2019, from Inland Revenue Department [NZ]: https://www.ird.govt.nz/gst/gst-registering/register-who/register-who.html
- McIntosh, R. (2011). Accounting Principles: The New Zealnad Context (3rd edition). New Zealand : Pearson Australia.
- Smart, M.J., Awan, N., & Baxter, R. (2012). Financial accounting: a New Zealand Perspective (3rd edition). Auckland: Pearson.
-